The Clover Coverage Explorer
The Coverage Explorer allows you to view and control Clover's instrumentation of your Java projects, and shows you the coverage statistics for each project based on recent test runs or application runs. It is automatically added to the workbench when you enable Clover for your project. If the viewer is closed, you can open it again using "Window | Show View | Other..." and selecting "Clover | Coverage Explorer".
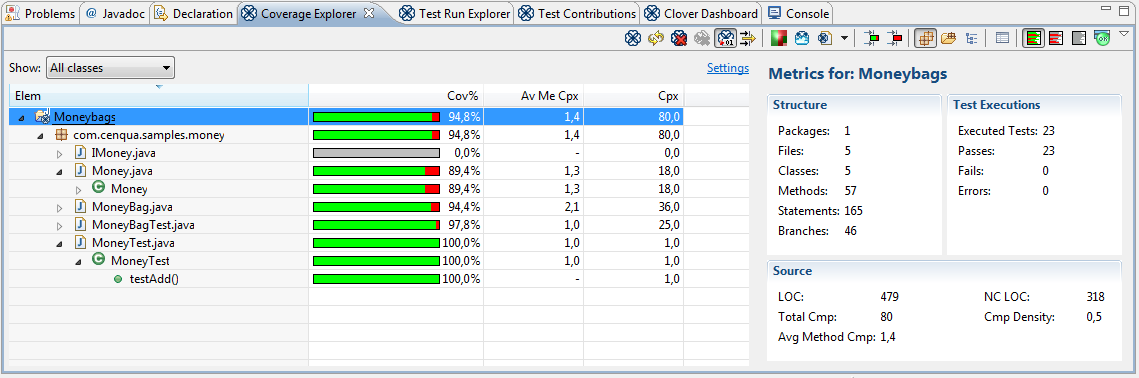
The main tree shows coverage and metrics information for packages, files, class and methods of any Clover-enabled project in your workspace. Clover will auto-detect which classes are your tests and which are your application classes - by using the drop-down box above the tree you can then restrict the coverage tree shown so that you only see coverage for application classes, test classes or both.
Screenshot: Clover Coverage Explorer
Columns
Initially the Coverage Explorer's tree displays the following four columns:
- Element - The name of the package, file, class or method.
- %TOTAL Coverage - The total coverage of the element as a percentage.
- Complexity - The cyclomatic complexity of the element
- Average Method Complexity - The average method complexity of the element
Clover supports 24 standard column types which can be chosen in the Coverage Explorer Column Chooser. The Column Chooser can be summoned by selecting "Columns..." in the Coverage Explorer view menu.
Screenshot: Coverage Explorer Column Chooser

Clover-for-Eclipse also lets your define your own custom columns for display within the Coverage Explorer tree. While choosing columns in the Column Chooser dialog, click the "New" button to summon the Custom Column Builder dialog. Custom columns must have a name and a valid Clover expression. Custom columns may be left, center or right justified and the value may be displayed as a decimal value or as a percentage value. Clover expressions can refer to any of the 24 standard columns; these references can be easily inserted into the expression by selecting "Insert..." and choosing the appropriate column name.
Screenshot: Coverage Explorer Custom Column Builder

Summary Panel
Summary metrics are displayed alongside the tree for the selected project, package, file, class or method in the tree. The following metrics are provided:
- Structure
- Packages: The number of packages the project or package root contains
- Files: The number of files the package, package root or project contains
- Classes: The number of classes the file, package, package root or project contains
- Methods: The number of methods the class, file, package, package root or project contains
- Statements: The number of statements the method, class, file, package, package root or project contains
- Branches: The number of branches the method, class, file, package, package root or project contains
- Tests:
- Tests: The total number of tests in the class, file, package, package root or project
- Passes: The total number of passing tests in the class, file, package, package root or project
- Fails: The total number of failing tests in the class, file, package, package root or project
- Errors: The total number of tests with errors in the class, file, package, package root or project. Currently Clover does not differentiate between fails and errors and counts all errors as failures.
- Source:
- LOC: The total number of lines of code in the class, file, package, package root or project
- NC LOC: The total number of non-commented lines of code in the class, file, package, package root or project
- Total Cmp: The total cyclomatic complexity of code in the method, class, file, package, package root or project
- Avg Method Cmp: The average method complexity of the class, file, package, package root or project
- Cmp Density: The complexity density of code in the class, file, package, package root or project
Actions and Menus
The Coverage Explorer view allows the following actions (from the view toolbar, menu or both):
- Enable/Disable Clover On... Allows you to select multiple project to enable or disable Clover for. This allows you, for example, to quickly turn Clover on for all projects in your workspace in one action.
- Refresh Coverage Data. Re-loads from disk the Clover coverage data for the selected project.
- Delete Coverage Recordings. Deletes the coverage recording data recorded from test runs or applications runs for the selected project.
- Clear Snapshot Deletes the Test Optimization snapshot file
- Compiled with Clover. Toggles the use of Clover instrumentation when Eclipse compiles the selected Java project.
- Edit Context Filter... Allows you to edit the block and custom coverage
'contexts' used to help you filter out unwanted coverage data. An explanation of what contexts
are can be found here.
- Generate Coverage Treemap. Generates a mini report page in treemap format for the selected project. This report arranges package and classes enabling easy comparison of their complexity while also indicating their level of code coverage.
- Generate Coverage Cloud. Generates a report page in cloud tag format for the selected project. This lists classes considered project risks or quick wins.
- Coverage Reports > Run new report... Launches the report generation wizard that will take you through the steps required to generate a PDF, HTML or XML. These reports can be generated for single or multiple projects.
- Coverage Reports > View report Browse recently generated
reports.
- Coverage in Explorer > Show All Classes. Shows code coverage for all application and test classes in the Coverage Explorer.
- Coverage in Explorer > Show Only Application Classes. Shows code coverage only for application (non-test) classes in the Coverage Explorer.
- Coverage in Explorer > Show Only Test Classes. Shows code coverage only for
test classes in the Coverage Explorer.
- Enable Clover Working Set. Enables or disables usage of the Clover working set. This filters the files, directories and projects that Clover will report on and are especially handy for large projects.
- Edit Clover Working Set... Allows you to edit the files, directories and projects in the Clover working set.
- Clear Clover Working Set. Removes all files, directories and projects from the
Clover working set.
- Hide Unavailable. This check button hides any elements in the Coverage Explorer's tree that don't have associated coverage information and helps reduce visual clutter. For instance, with this button checked any project that isn't Clover-enabled will not be shown in the Coverage View.
- Hide 100% Covered. This check button hides any elements in the Coverage
Explorer's tree that have full coverage and helps you focus on only those classes that require
more testing.
- Layout > Packages. Arranges the coverage tree by package. This is useful if you have a single source directory for your project.
- Layout > Package Roots. Arranges the coverage tree first by package root, then by package. This is useful if you have multiple source directories within your project.
- Layout > Hierarchical packages Toggle showing packages in hierarchical
or flat list.
- Columns... Allows you to customize the columns shown shown in the Coverage
Explorer.
- Coverage in Editors > Show All. Shows red/green coverage areas in open Java editors. This is useful for finding out exactly which parts of the code are being covered.
- Coverage in Editors > Show Uncovered. Shows only red (uncovered) areas in open Java editors. This is useful for finding out exactly which parts of the code are not being covered while not cluttering your editor with the overwhelming large green areas (covered code).
- Coverage in Editors > Show None. Hides all red/green coverage areas in open Java editors.
- Include passed only If enabled, code coverage from failed tests will not be taken into account.
- Show exclusion annotations If enabled, draws small Clover icons in the Package Explorer view for every source file, indicating whether it's included or excluded from instrumentation.
- About Shows information about Clover version, copyright and licenses.
The Coverage Explorer view has also actions accessible from buttons and links in browser (left panel) as well as on left/right click on elements in a browser:
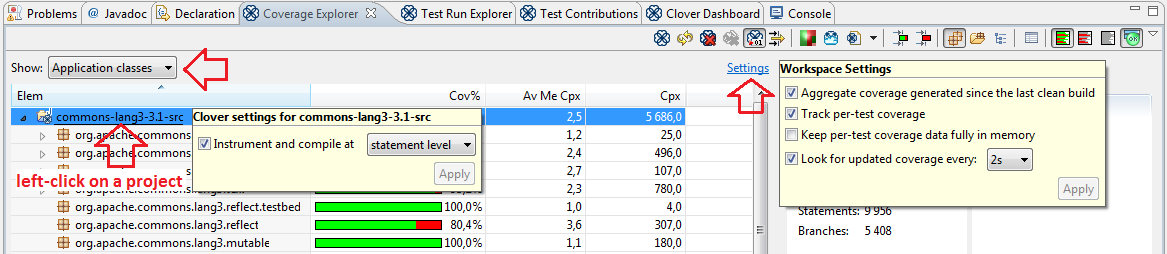
- Show: All Classes Shows code coverage for all application and test classes in the Coverage Explorer.
- Show: Application classes Shows code coverage only for application (non-test) classes in the Coverage Explorer.
- Show: Test classes Shows code coverage only for test classes in the Coverage
Explorer.
- Workspace Settings > Aggregate coverage generated since the last clean build If enabled, coverage from all test or application runs will sum up (the "Delete Coverage Recordings" action or full project rebuild will clean them).
- Workspace Settings > Track per-test coverage If enabled, Clover will track individual code coverage generated by every test case. It's useful for checking what code has been exactly covered by given tests or which tests are the most relevant for given application code.
- Workspace Settings > Keep per-test coverage data fully in memory If enabled, per-test coverage will be stored in memory instead temporary files on disk. Attention: can consume a lot of memory.
- Workspace Settings > Look for updated coverage every N s Whether and how
frequently Clover should refresh coverage view
- Project Settings > Instrument and compile The "statement level" is recommended as it gives the most accurate information. The "method level" records only whether given method was called or not; it can be used for very large projects (as produces smaller instrumentation overhead and compiles faster) or when you need just rough information about coverage.
Viewing Coverage Results
The Clover-for-Eclipse plugin shows coverage data in number of ways. Viewing any coverage data, of course, requires that you have executed tests or you have launched your application and it also requires that Clover has detected the change in coverage. On the Clover preferences page, you can change how often Clover looks for new coverage data for your application or tests.
Source Code Annotations
To view coverage information on a line-by-line basis, Clover adds colored annotations to your project's Java source code editors.
Screenshot: Clover Source Annotations in Java editor
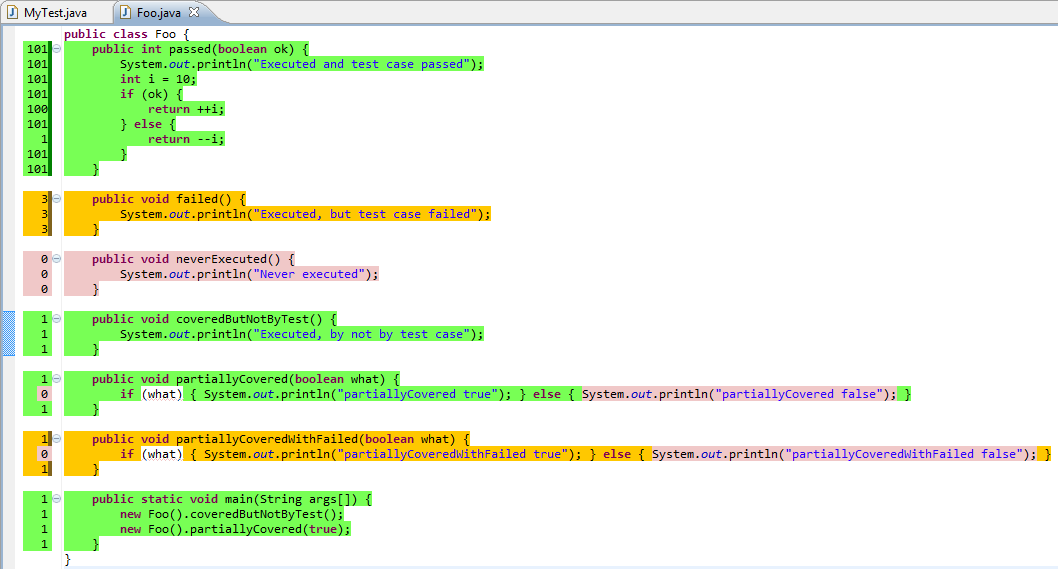
The table below explains the meanings of various colors:
| Annotation Color | Meaning |
|---|---|
| Green | Coverage from passing tests. |
| Green | Coverage caused incidentally (caused by something other than test methods, e.g. main() methods, test setUp() and tearDown() methods). A different tooltip is presented to show it is incidental. |
| Squiggly Red Lines | Partial branch coverage (caused when only one part of a branch has been covered). |
| Yellow | Failed test coverage (where coverage has only been caused by one or more failing tests and no passing tests). |
| Grey | Filtered out code. |
| Red | Code with no coverage. |
A left margin ruler shows three color markers:
- left half - green if at least part of line is covered, yellow if at least part of line is covered but only from failed tests, red if line is not covered at all (it's an "optimistic marker")
- right half - red if at least part of line is not covered, yellow if at least part of line is covered but only from failed tests, green for fully covered line (it's an "pessimistic marker")
- right strip - dark green for coverage related with passed tests, dark yellow for coverage related with failed tests
![]() In case you don't see hit counts on a left
margin ruler, then right click on it and ensure you have the "Show touching tests" toggle
enabled.
In case you don't see hit counts on a left
margin ruler, then right click on it and ensure you have the "Show touching tests" toggle
enabled.
Each coloured source annotation displays a tool tip providing more information about the relevant line or lines. These coverage annotations are added automatically to any opened source files from a Clover-enabled project. For example, if a statement was executed ten times, or a conditional expression was only executed twice in the true case but never in the false case, this information will appear in the tool tip.
If you wish to switch off the source code annotations, you can easily do so by de-selecting the menu / toolbar item "Show Coverage in Editor" on the Coverage Explorer view or Test Run Explorer view. Using an adjacent menu / toolbar item you can also force Clover to only annotate code without coverage, thus only showing the red annotations.
You can also change these colours and effects in Eclipse. To do so, access 'Eclipse Preferences > General > Editors > Text Editors > Annotations'. On this page, see the 'Annotation Types' list and click the settings that begin with 'Clover'.
Screenshot: Clover Source Annotation Settings

Coverage Cloud Reports
Coverage cloud report are a great way to work out the classes that form major risks (low coverage but high complexity) to your project and its packages, and also to highlight potential quick wins for increasing the overall project or per-package coverage.
The coverage cloud report has two tabs, one tab for the project/package risks cloud and the other for quick wins cloud. Each cloud shows the classes of the project/package enlarged or reduced depending on their significance to the report and clicking on any class name will open the corresponding source file in an editor. At the bottom of the report you can select the target for the clouds - either the entire project or one of the packages within the project - changing this will update the cloud tabs. Where a package is selected and has sub-packages, the checkbox "Include classes from sub-packages" allows you to include or exclude sub-package clouds from the clouds.
The coverage cloud report can be generated by right clicking on your Clover-enabled project in the Coverage Explorer view or Test Run Explorer view and selecting Generate Coverage Cloud.
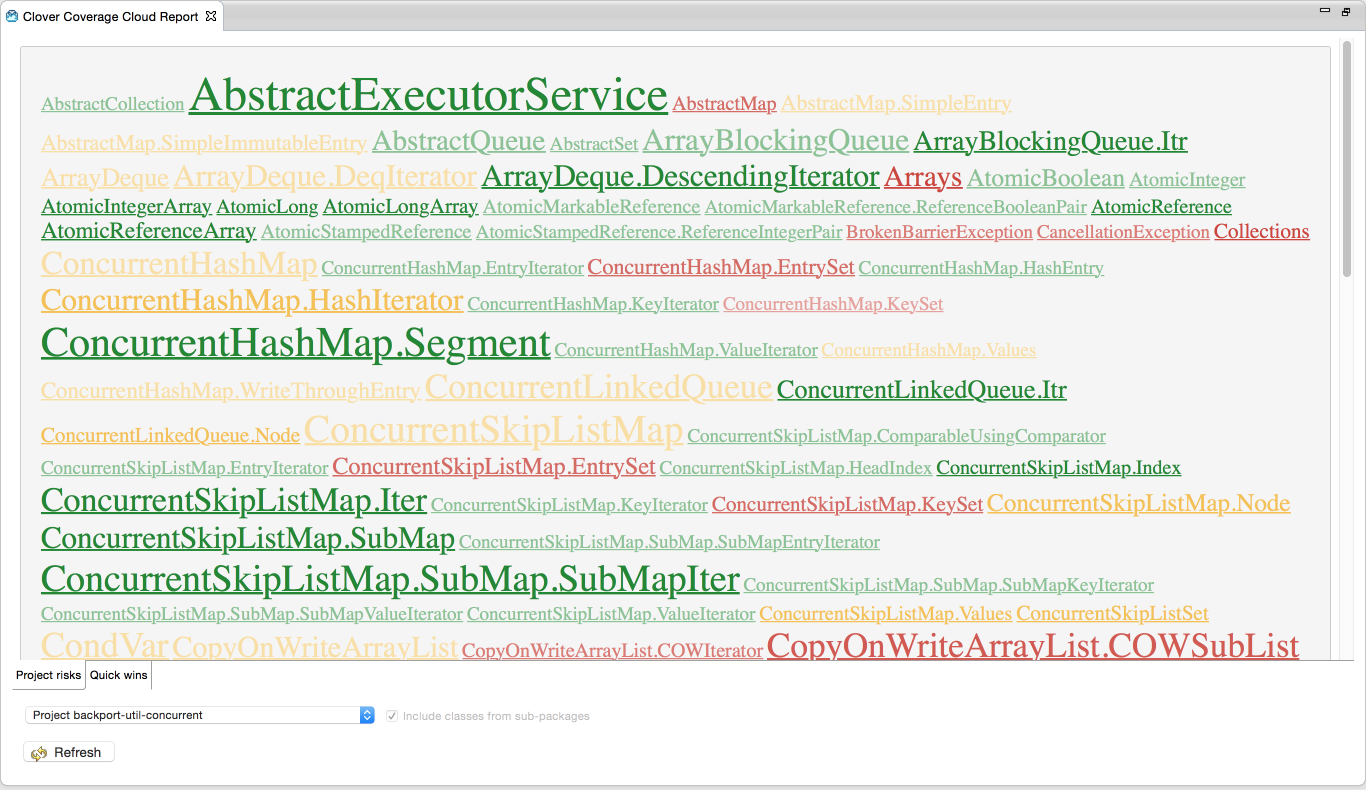
Package Risks
The Package Risks Cloud highlights those classes that are the most complex, yet are the least covered by your tests. The larger and redder the class, the greater the risk that class poses for your project or package. Package risk clouds can be toggled to include or exclude classes in sub-packages.
|
Metric |
Attribute |
|---|---|
| Average Method Complexity | Font Size |
| % Coverage | Font Color |
Quick Wins
This Cloud highlights the "low hanging coverage fruit" of your project or package. You will achieve the greatest increase in overall project coverage by covering the largest, reddest classes first. Package Quick Win clouds can be toggled to include or exclude classes in sub-packages.
|
Metric |
Attribute |
|---|---|
| Number of Elements | Font Size |
| Number of Elements Untested | Font Color |
Coverage Treemap Reports
The coverage treemap report allows simultaneous comparison of classes and package by complexity and by code coverage. The treemap is divided by package (labeled) and then further divided by class (unlabeled). The size of the package or class indicates its complexity (larger squares indicate great complexity, while smaller squares indicate less complexity). Colors indicate the level of coverage, as follows:
- Bright green (most covered)
- Dark green (more coverage)
- Black (around 50% coverage)
- Dark Red (little coverage)
- Bright Red (uncovered)
The percentage shown in the yellow box is the code coverage for the class currently under the mouse.
Right clicking on a package area and selecting the magnify option will then focus the treemap on the package's classes. Right clicking again and selecting the demagnify option will re-focus on the project's top level. Double clicking on a class will open the corresponding source file in an editor.
The treemap cloud report can be generated by right clicking on your Clover-enabled project in the
Coverage Explorer and selecting Generate Coverage Treemap. You can also click on a Generate
a coverage treemap button.
Now you perfectly know how your application is covered. But how to efficiently navigate between tests and application code? Read the 3. Exploration of test results in Eclipse chapter.